
TA & MIT Spatial Equity NYC: Data Visualization & Social
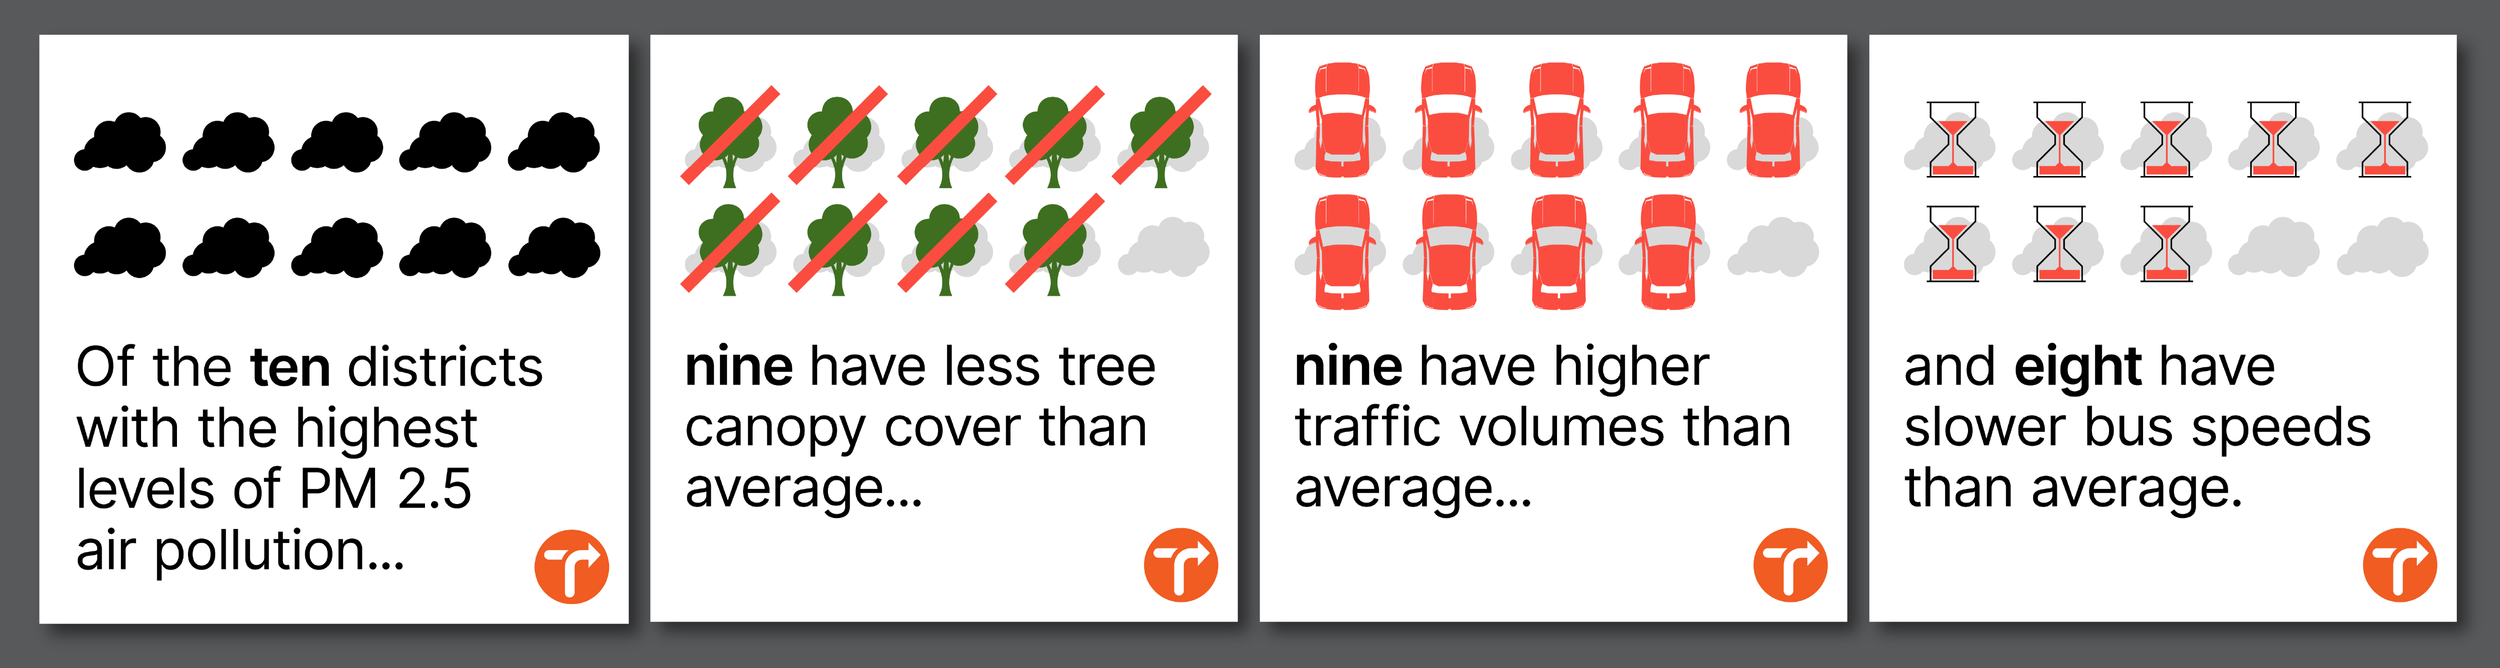
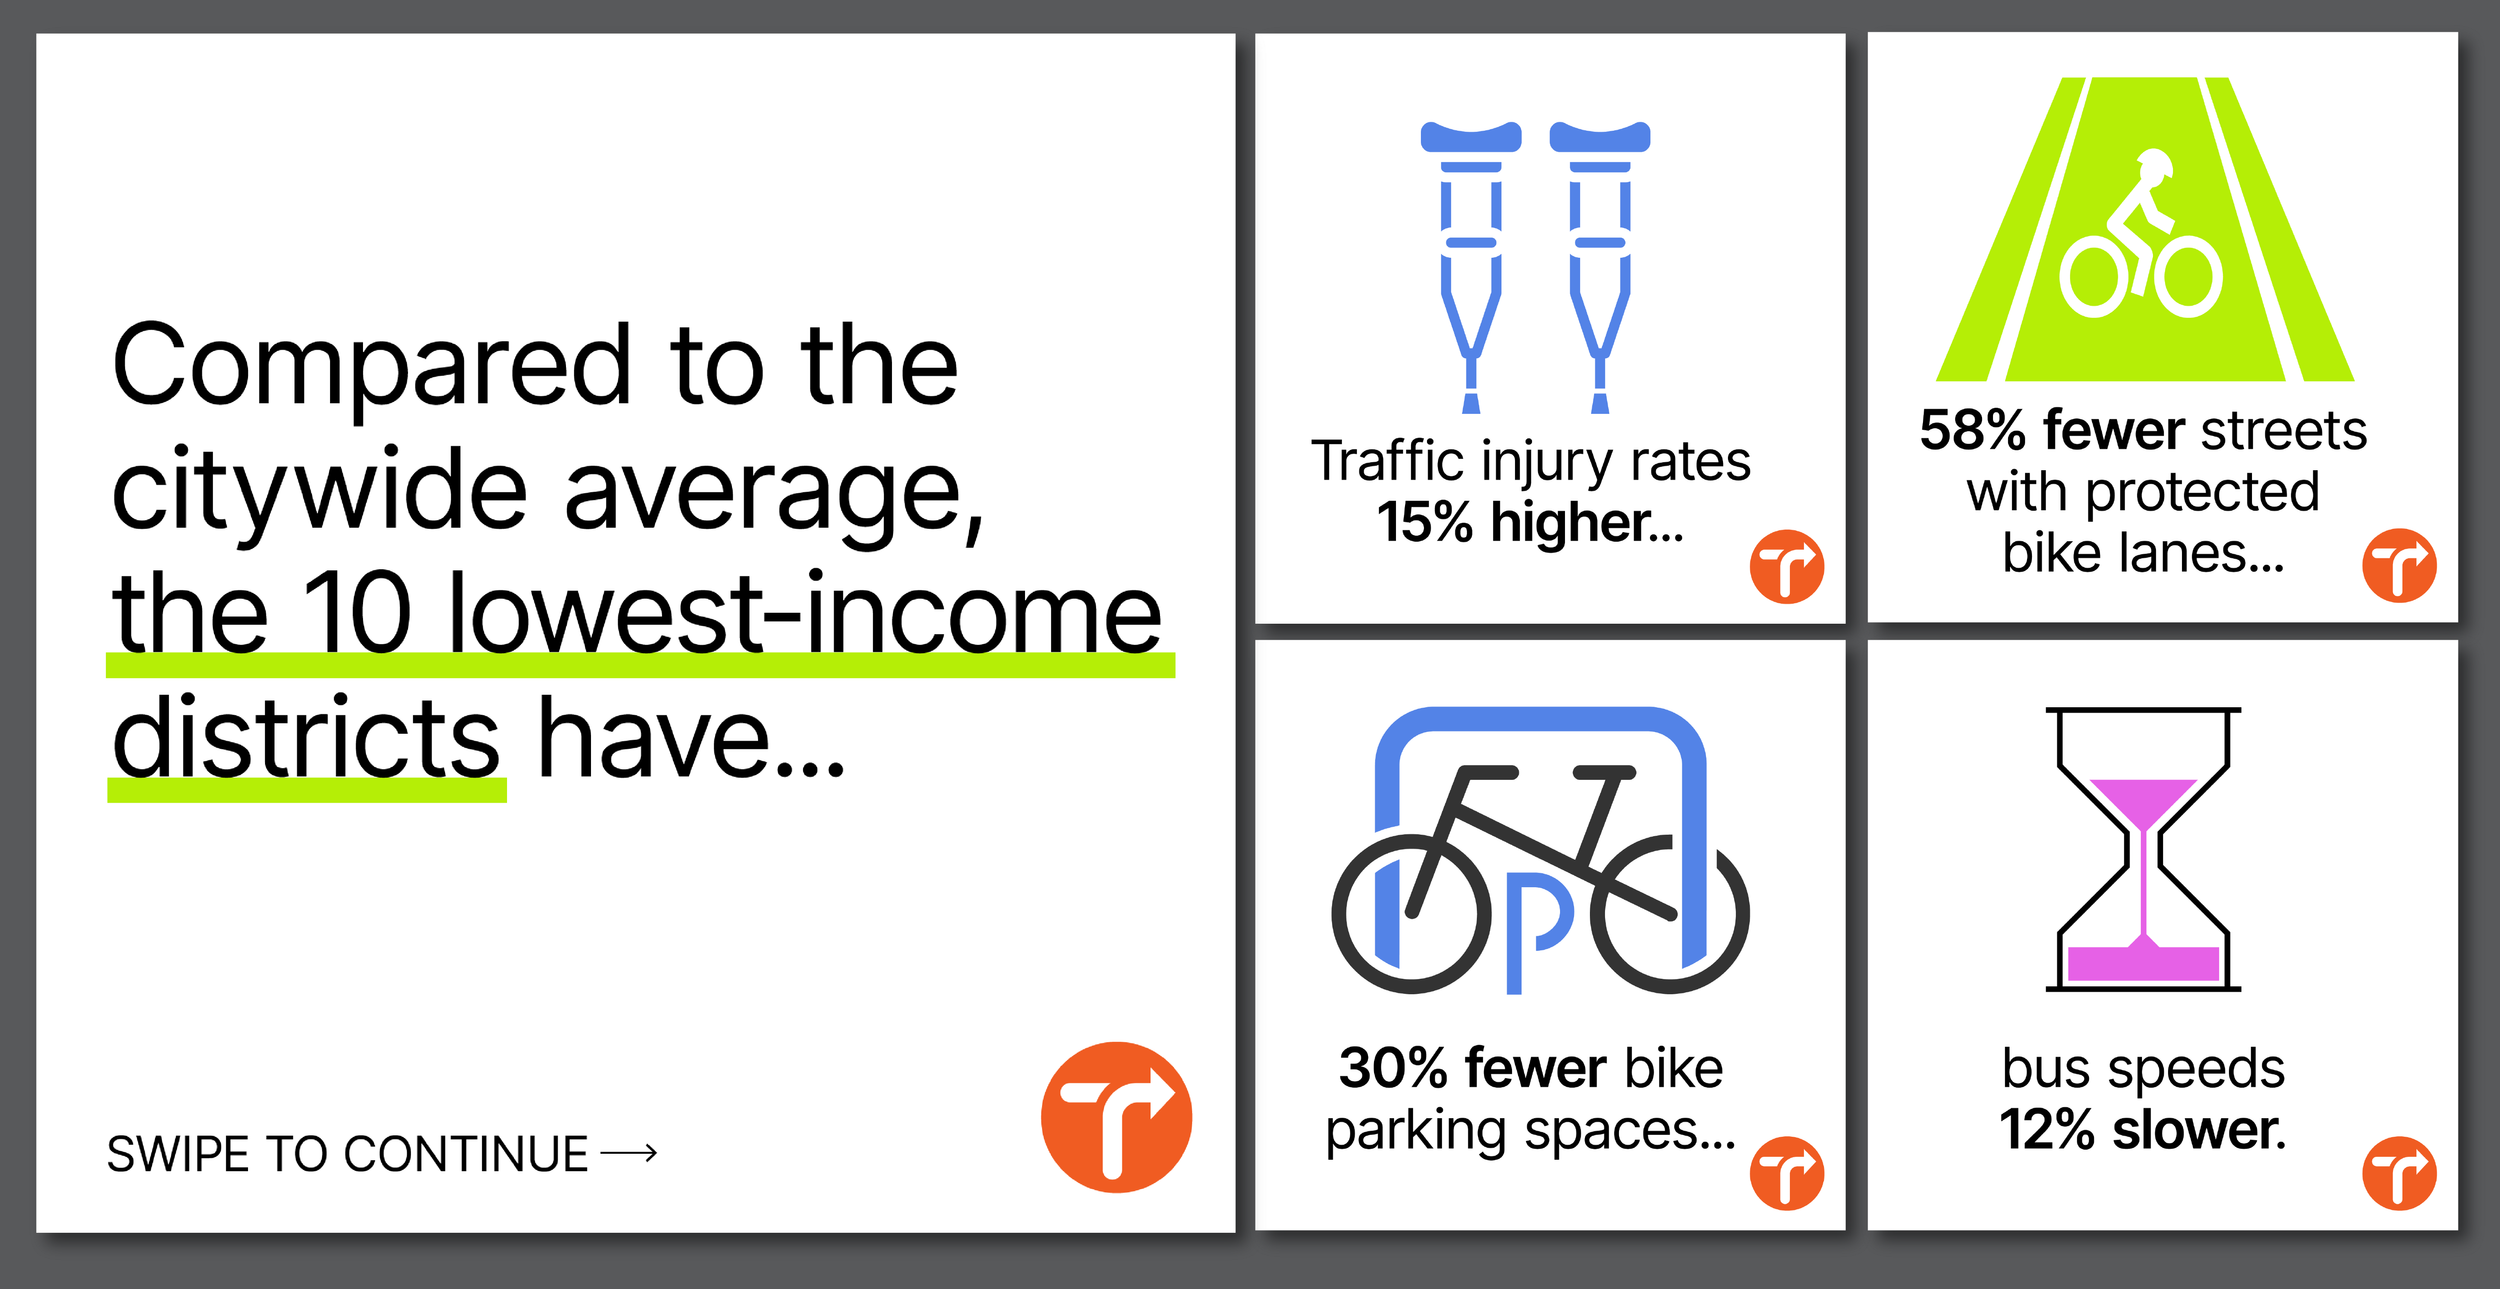
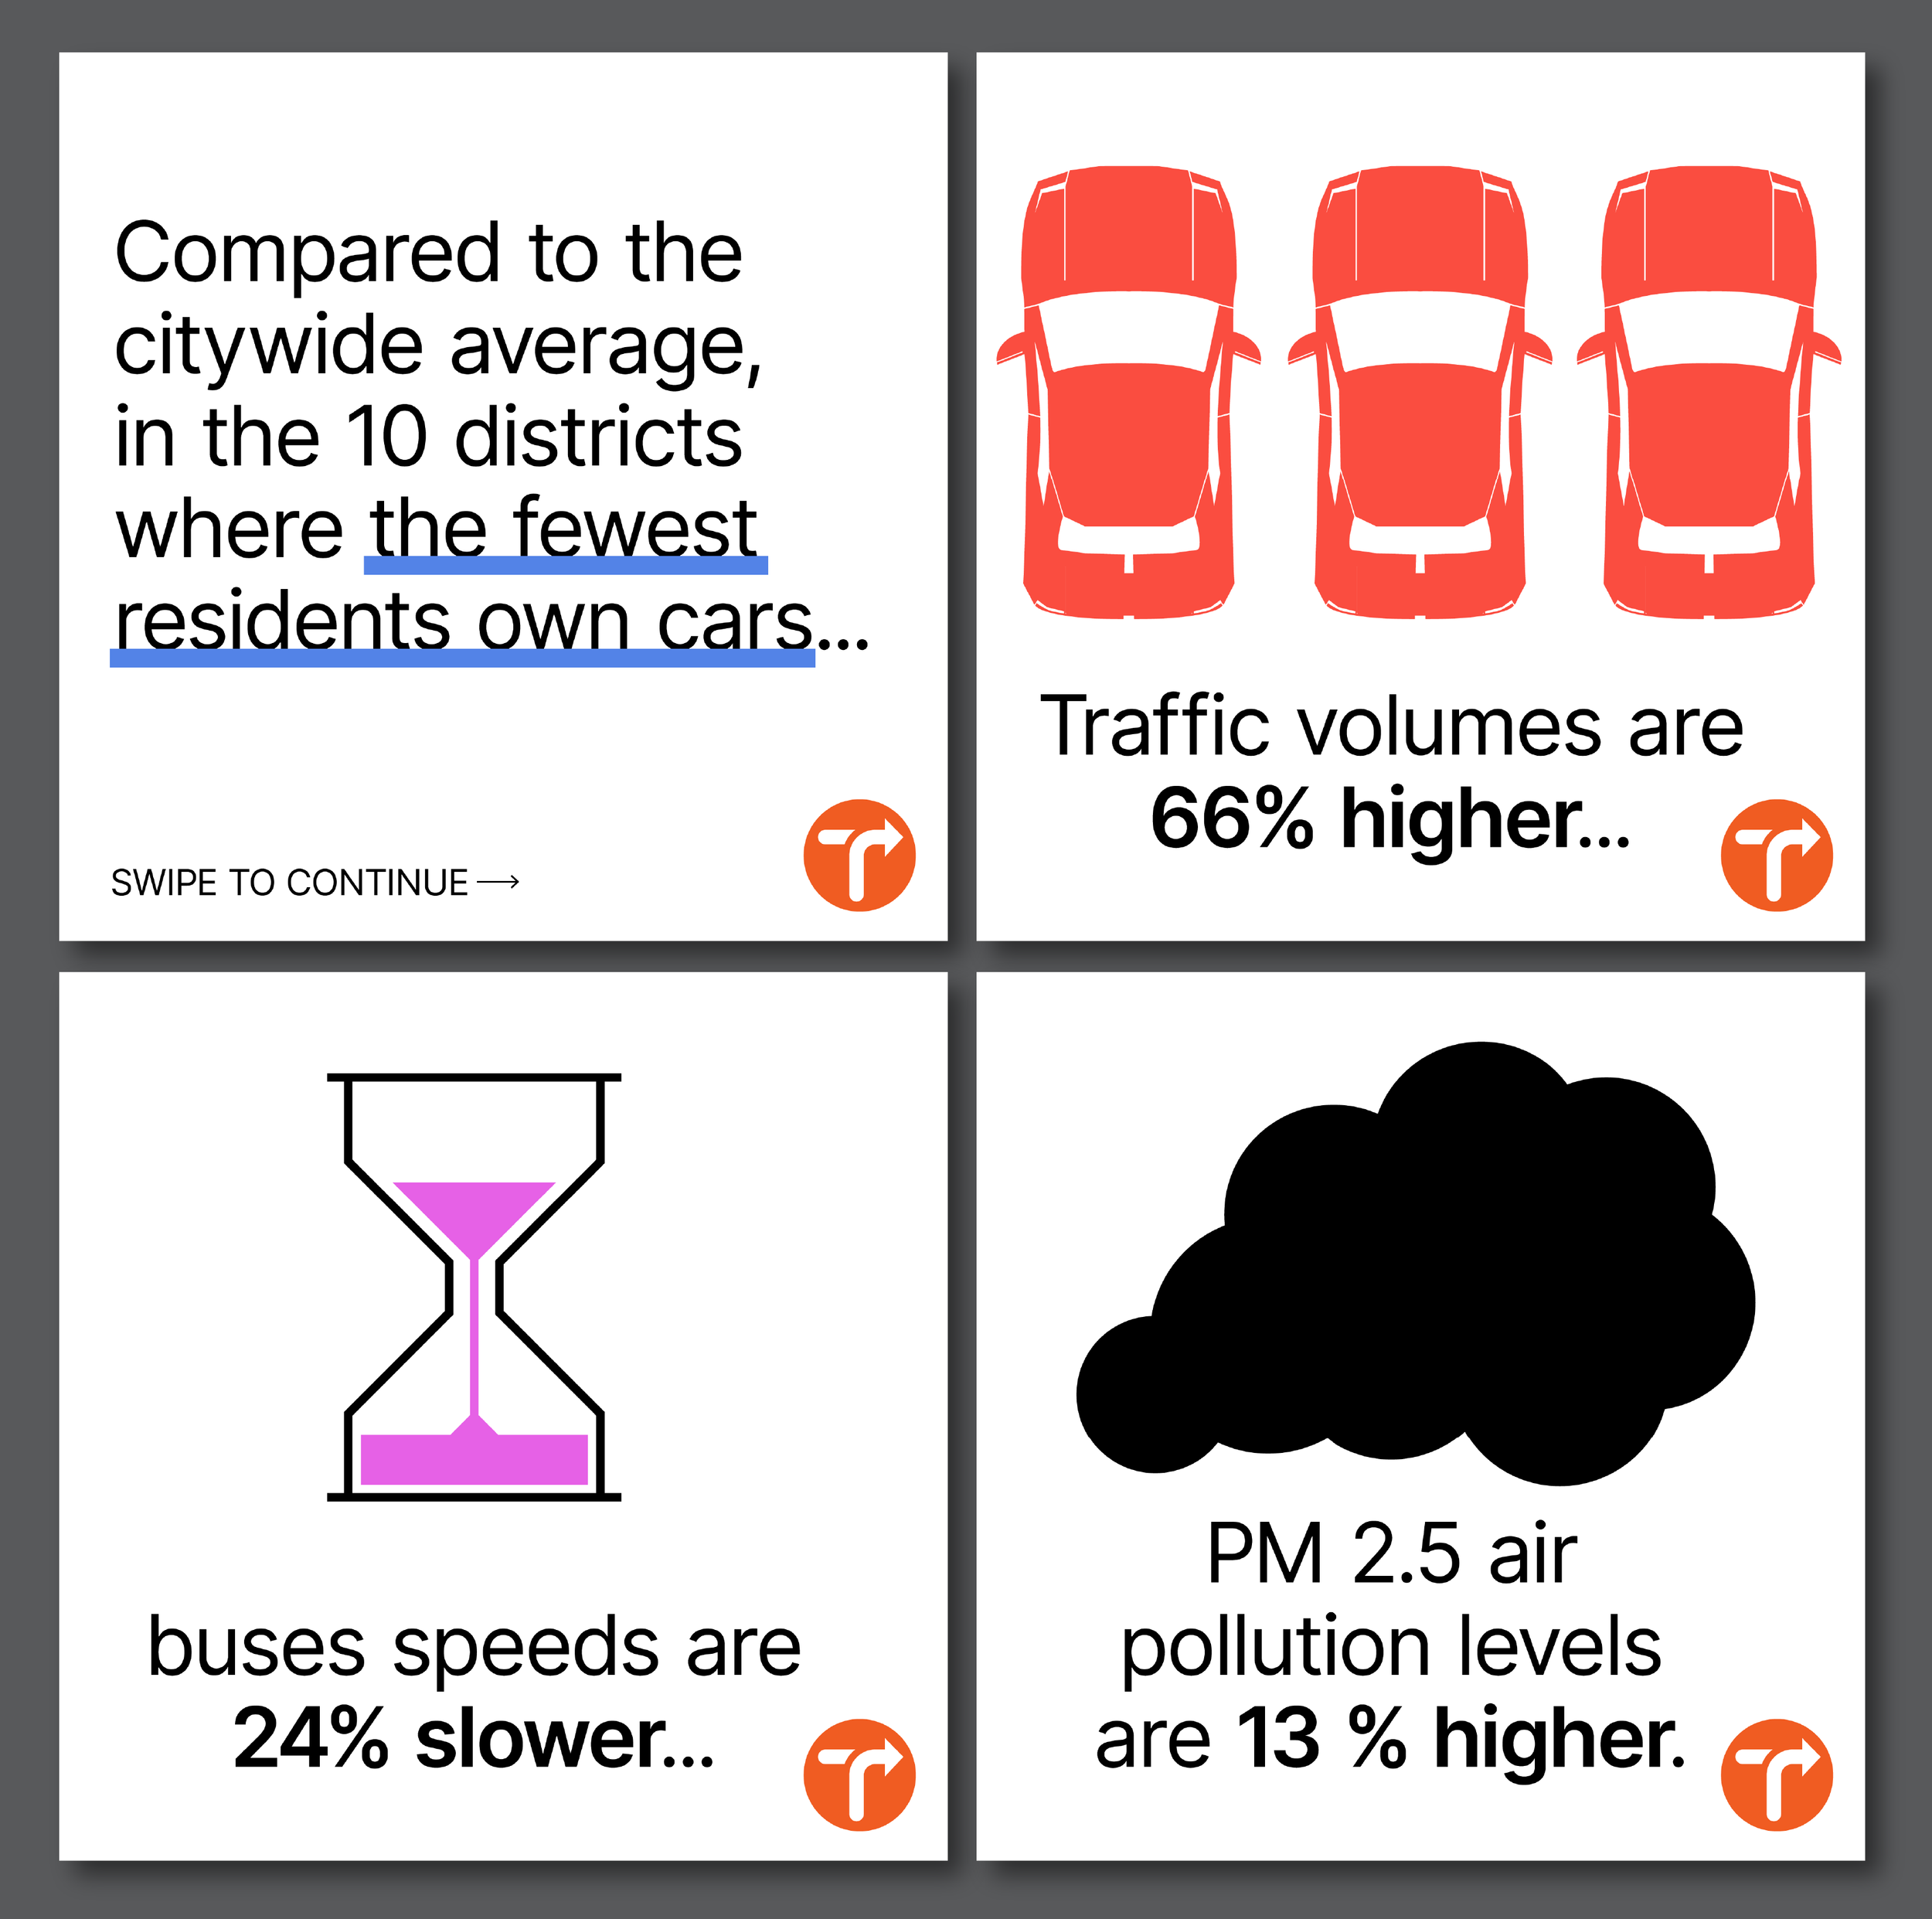
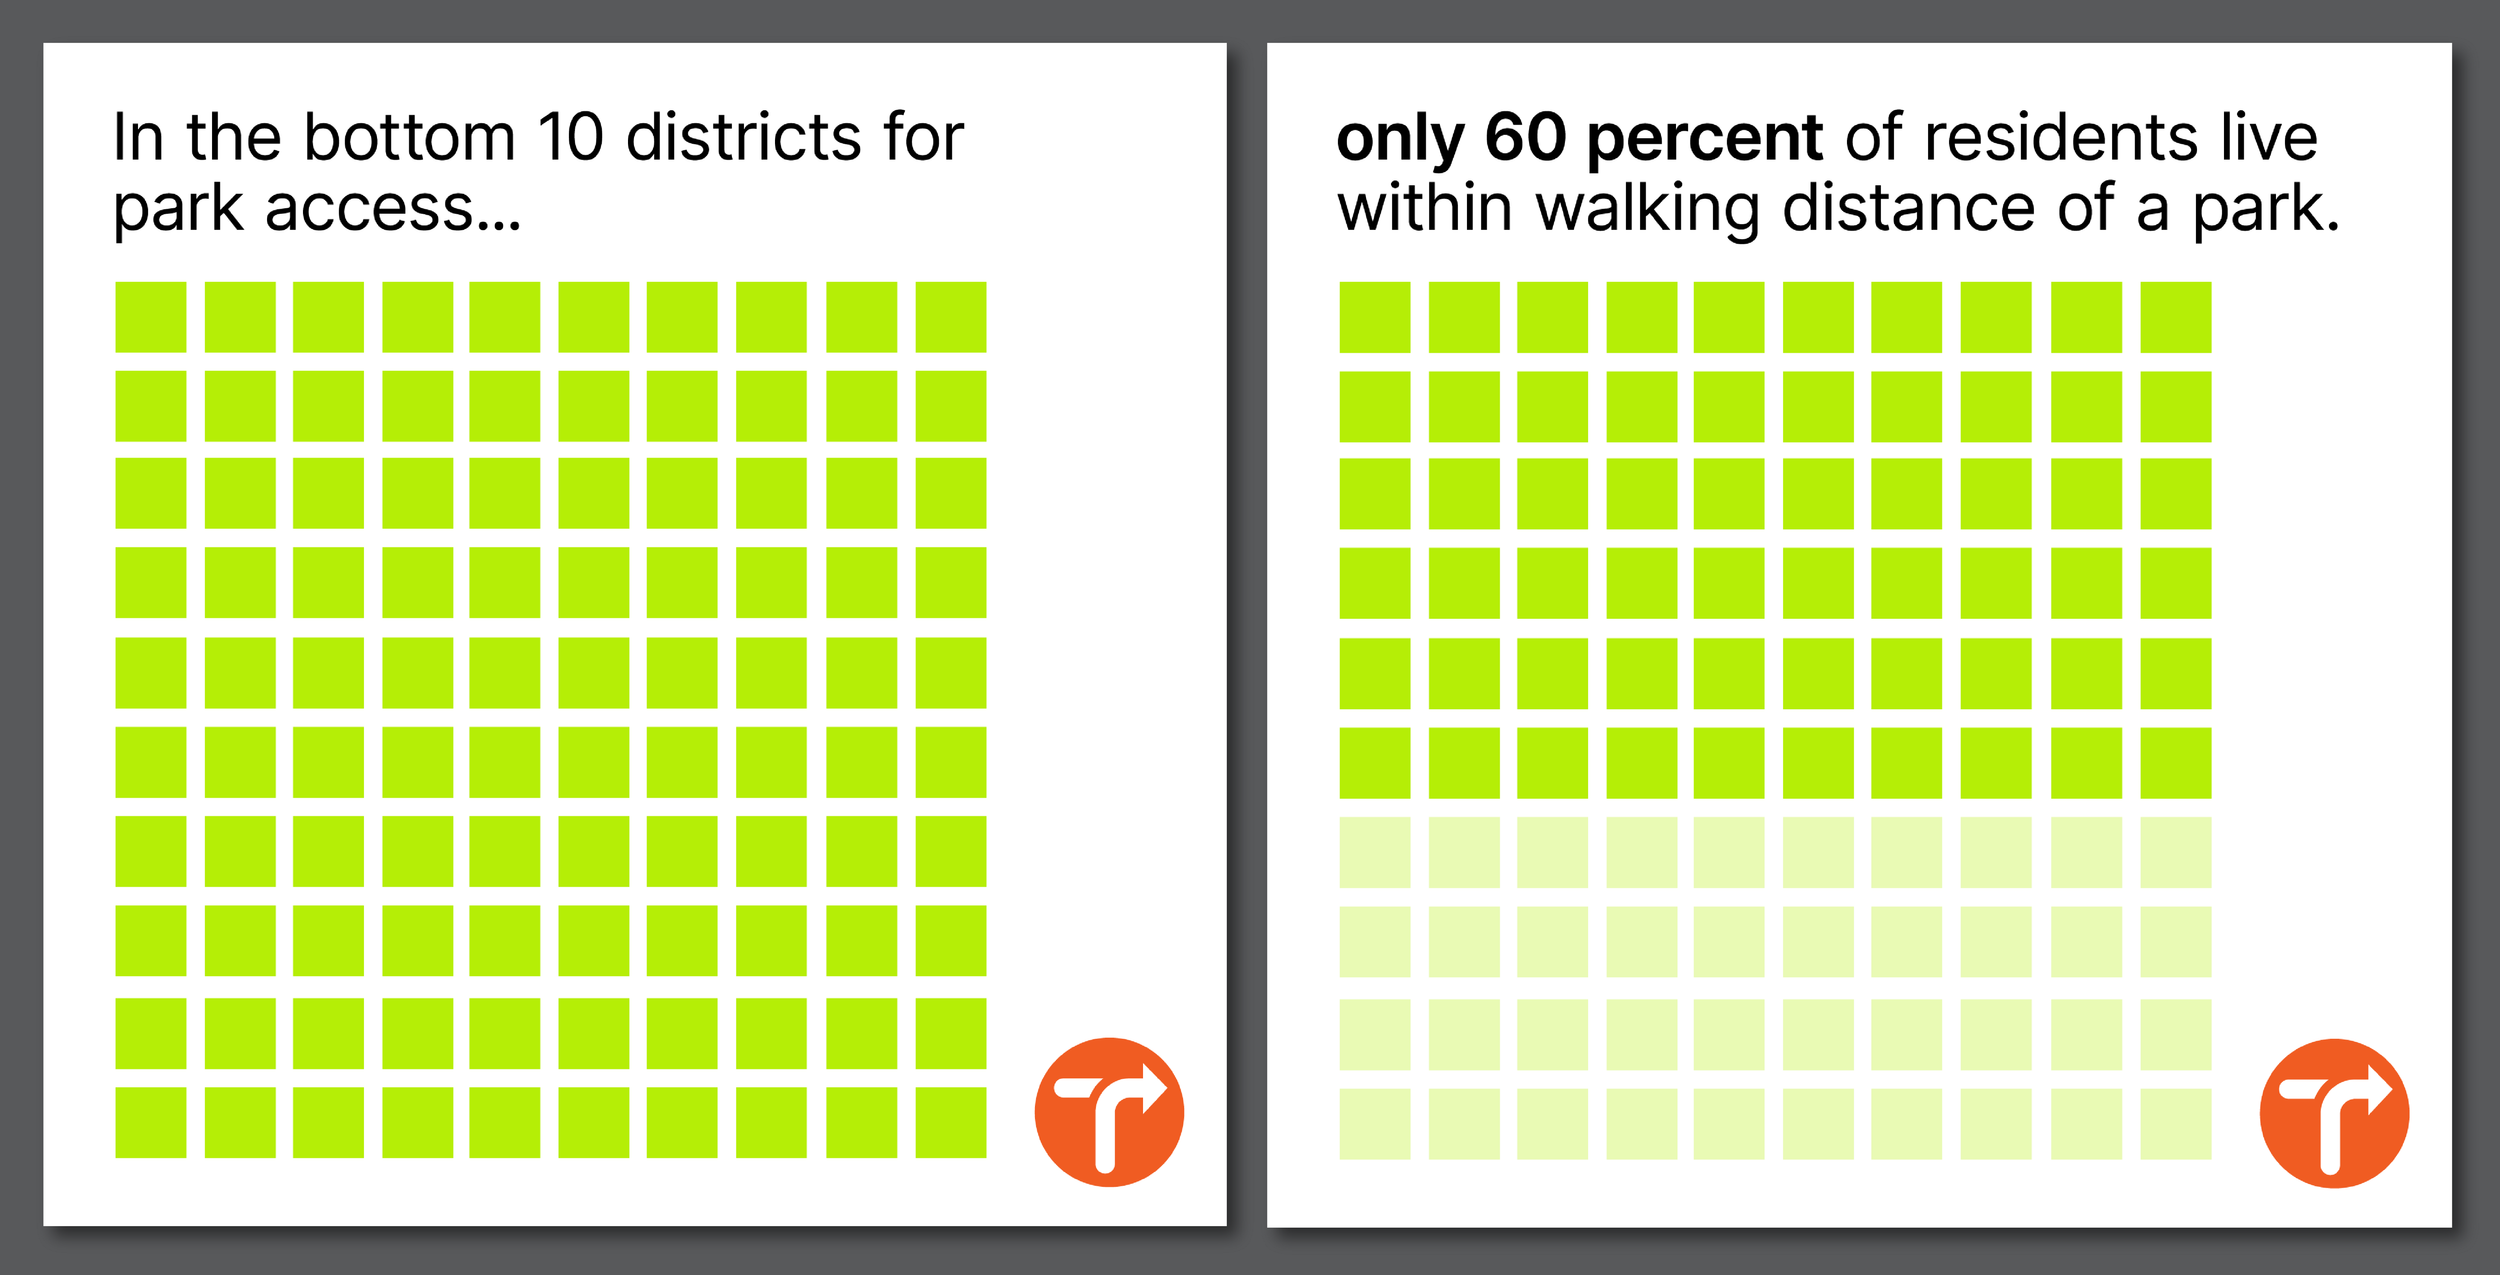
In collaboration with the Research team at Transportation Alternatives, I created data visualizations for the statistics that were made possible by the web tool Spatial Equity NYC. Spatial Equity NYC uses open data to show clear disparities in health, environment, and mobility across race, income, and geography in NYC. Each image here is a set of carousels on Instagram, where the user scrolls to see the next slide. spatialequity.nyc


Back to Data Visualization
Back to Portfolio